Professional graphite material supplier, graphite for EV, grease, furnace and any other industries.
Products
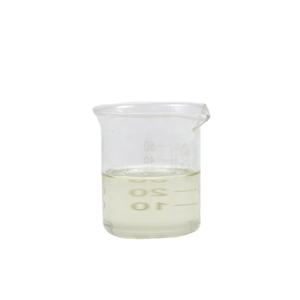
Factory Whole 1000ML 20H Graphene Coating Super Hydrophobic Anti Scratch Repair Car Body Ceramic Coating Original liquid
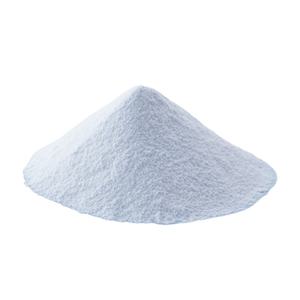
High Purity 99.8% Single Layer Graphene Nanoparticles Best for New Energy Batteries
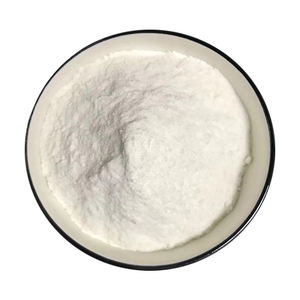
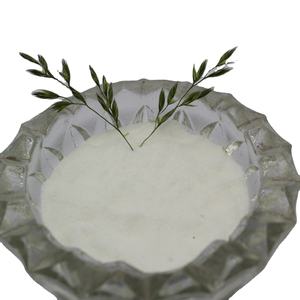
Graphene oxide nano powder (Micron graphene oxide powder)
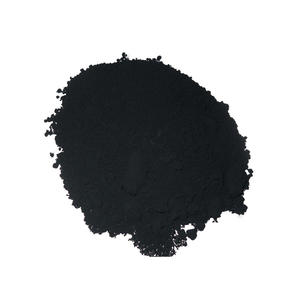
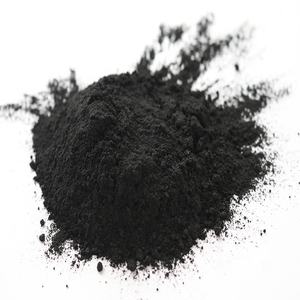
Research Grade Single/Few Layer RGO Reduced Graphene Oxide Powder
Best Quality Graphene Portable Home Heater Under Table Electric Foot Warmer for office and home
graphene!Disposable mattress Medical mattress draw sheet Bactericidal bacteriostasis disinfects the bed sheet
graphene mask sheet deep cleansing
PET Graphite Gasket Conductivity Thermal Sheets Graphene Sheet
10h 30ml High Quality Car Paint Ceramic Coating Agent Anti-Scratch Hydrophobic Graphene Protective Coatings For Cars
Design Simple Facility Houseboat Residential Building Graphene Eps Prefabricated Dome Residential House With Several Windows
Graphene 2022 Most Popular Room Thermostat Far-infrared Carbon Heating Film Excel Korea